Why Isolating Institutional Flow Creates an Edge
Large market participants rarely buy or sell in one go. To reduce their own price impact and fulfil fiduciary obligations, institutions break their trades into smaller meta‑orders that are executed over minutes, hours or days. These fragmented orders leave persistent footprints on the tape – patterns of displacement, fair‑value gaps and liquidity sweeps – that reveal the conviction and intent behind the move. Unlike simple trend following, the edge comes from understanding who is behind the price move and how much inventory remains to be executed. Academic research shows that the market impact of a large trade increases roughly with the square root of its duration, and prices revert to fair value once the order completes, creating opportunities to both ride the wave and fade it later.
When you can identify where the smart money is positioned you can avoid buying into downtrends and selling into uptrends, lean into sectors and industries where capital is actively rotating, and pinpoint high‑probability entry zones instead of chasing noise.
Market Microstructure: Opportunity in Imperfection
Financial markets are not frictionless. Order handling costs, asymmetric information and the strategic behaviour of traders cause short‑term transaction prices to deviate from long‑term fundamental values. Institutions delegate execution to brokers and algorithms, and the existence of large strategic traders means that a non‑trivial share of market volume is informed. These frictions, studied under the field of market microstructure, create a landscape where information leakage and price impact become exploitable features.
Institutional order flow thus represents the purest form of supply and demand: when big players accumulate or distribute around specific price levels, those levels act like magnets. Recognising these magnets allows traders to set objective lines in the sand for support and resistance rather than relying on subjective chart patterns.
Information Asymmetry, HFT and Predatory Behaviour
The edge in institutional flow is fundamentally rooted in information asymmetry. There are two forms of leakage: exogenous (e.g. knowledge of upcoming announcements) and endogenous, which arises from the trading process itself. The very act of executing a large meta‑order signals intent to those who can detect it. High‑frequency traders (HFTs) act both as liquidity providers and as strategic predators: they often "lean against" large institutional orders initially, providing liquidity by trading in the opposite direction, before switching sides and trading with the order once its informed nature has been confirmed. This behaviour – sometimes called back‑running – illustrates how advanced participants infer private information by analysing order flow.
Other manipulative practices, such as predatory trading, front‑running and spoofing, show how some market participants exploit the need of large traders to offload inventory. Understanding these behaviours helps explain why institutional order flow is persistent and why sophisticated analytics can quantify the edge embedded within it.
Dark Pools, Off‑Exchange Trading and Cross‑Venue Signals
To hide their footprints, institutions frequently use Alternative Trading Systems such as dark pools to execute large block trades away from public exchanges. These venues provide a private forum where liquidity is not advertised and the size and identity of trades are not revealed until after execution. Yet even off‑exchange trading leaves subtle traces. Research shows that odd‑lot order activity on public exchanges spikes milliseconds before a dark‑pool print, followed by a rapid decrease. The existence of "iceberg orders" – partially hidden limit orders – and hidden odd‑lot orders provides a mechanism for inferring dark‑pool activity without seeing the order directly. Exploiting institutional flow therefore requires a multi‑venue approach: you can't simply watch one exchange; you must stitch together data from lit markets, dark pools and alternative venues to spot the ripples that betray a large hand at work.
Camouflage: How Big Players Try to Hide
Knowing they are being watched, sophisticated institutions employ order splitting, order shuffling and specialised order types to disguise their intent. Large meta‑orders are broken into smaller child orders executed through multiple brokers over time so that no single broker sees the full size. "Camouflage" strategies mix informed trades with uninformed orders to create noise and reduce detectability. Institutions also leverage dark pools and custom algorithmic orders that peg to the national best bid/offer to keep orders on a specific exchange. In response, advanced algorithms like the "sign‑flipping game" split a desired position into offsetting pieces so that an observer cannot determine whether the trader is net long or short. This technological arms race illustrates that, while institutions constantly seek to obscure their footprints, attentive analysis of broker turnover, trade durations and cross‑venue effects can still infer their presence.
Empirical Evidence: Non‑Linear Impact and Price Reversion
The edge in institutional flow isn't just theoretical – it's supported by empirical studies. Researchers have shown that the market impact of large trades is strongly concave: impact increases roughly as the square root of order size or trade duration rather than linearly. This means that the price impact per share is smaller for larger orders, creating predictable patterns in how price moves while a meta‑order is underway. After completion, prices tend to revert towards fair value in a multi‑regime decay: there is a power‑law decay over the first few minutes followed by an exponential decay thereafter. Understanding this decay curve allows traders to design strategies that ride the direction of a large institutional move and then bet on price snapping back once the order is completed.
Quantifying and Exploiting the Edge
Quantitative metrics like Expected Value and Edge Ratio can measure how much favourable price movement remains relative to adverse movement. Practitioners translate institutional flow into actionable strategies such as:
- Momentum: Riding the direction of a strong, institutionally driven trend. Signals like displacement and fair‑value gaps help identify high‑conviction moves.
- Mean Reversion: Betting that prices will snap back to an average after an institutional order has overextended them. This leverages the "rubber‑band" pull toward the mean once the order completes.
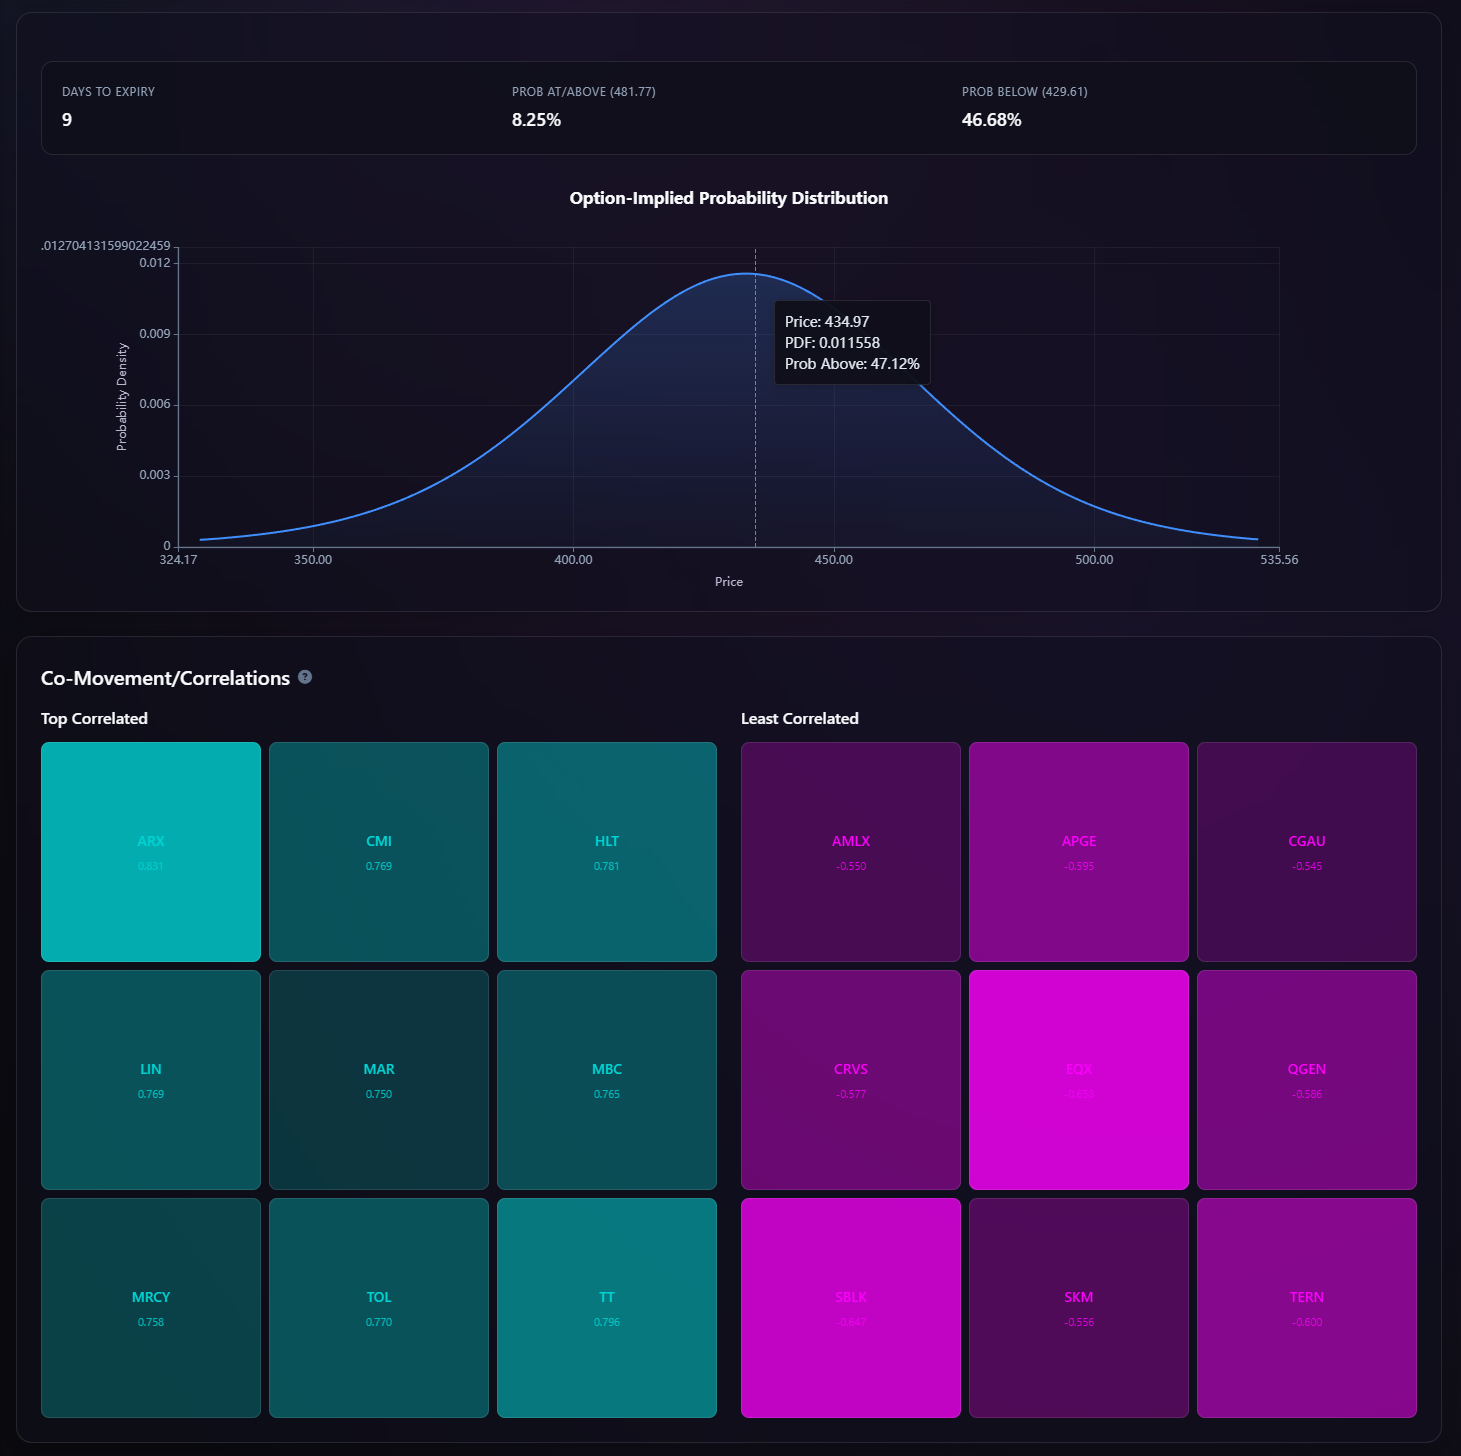
- Statistical Arbitrage: Exploiting temporary price deviations between correlated assets when a meta‑order in one creates dislocations in another.
- Back‑Running: Trading in the same direction as a large order once high‑frequency behaviour confirms its informed nature.
These strategies rely on robust analytics to separate meaningful institutional signals from noise and to determine when the edge is fading.
Conclusion: Bringing It All Together with STIX
The research and history of institutional order flow tell a clear story: persistent opportunities exist because large traders cannot conceal their intent entirely. Their need to execute large positions across venues and time, the non‑linear impact of their trades and the information asymmetries in market microstructure all leave exploitable footprints. Sophisticated players use multi‑venue data, advanced models and adaptive strategies to detect these footprints and quantify the edge.
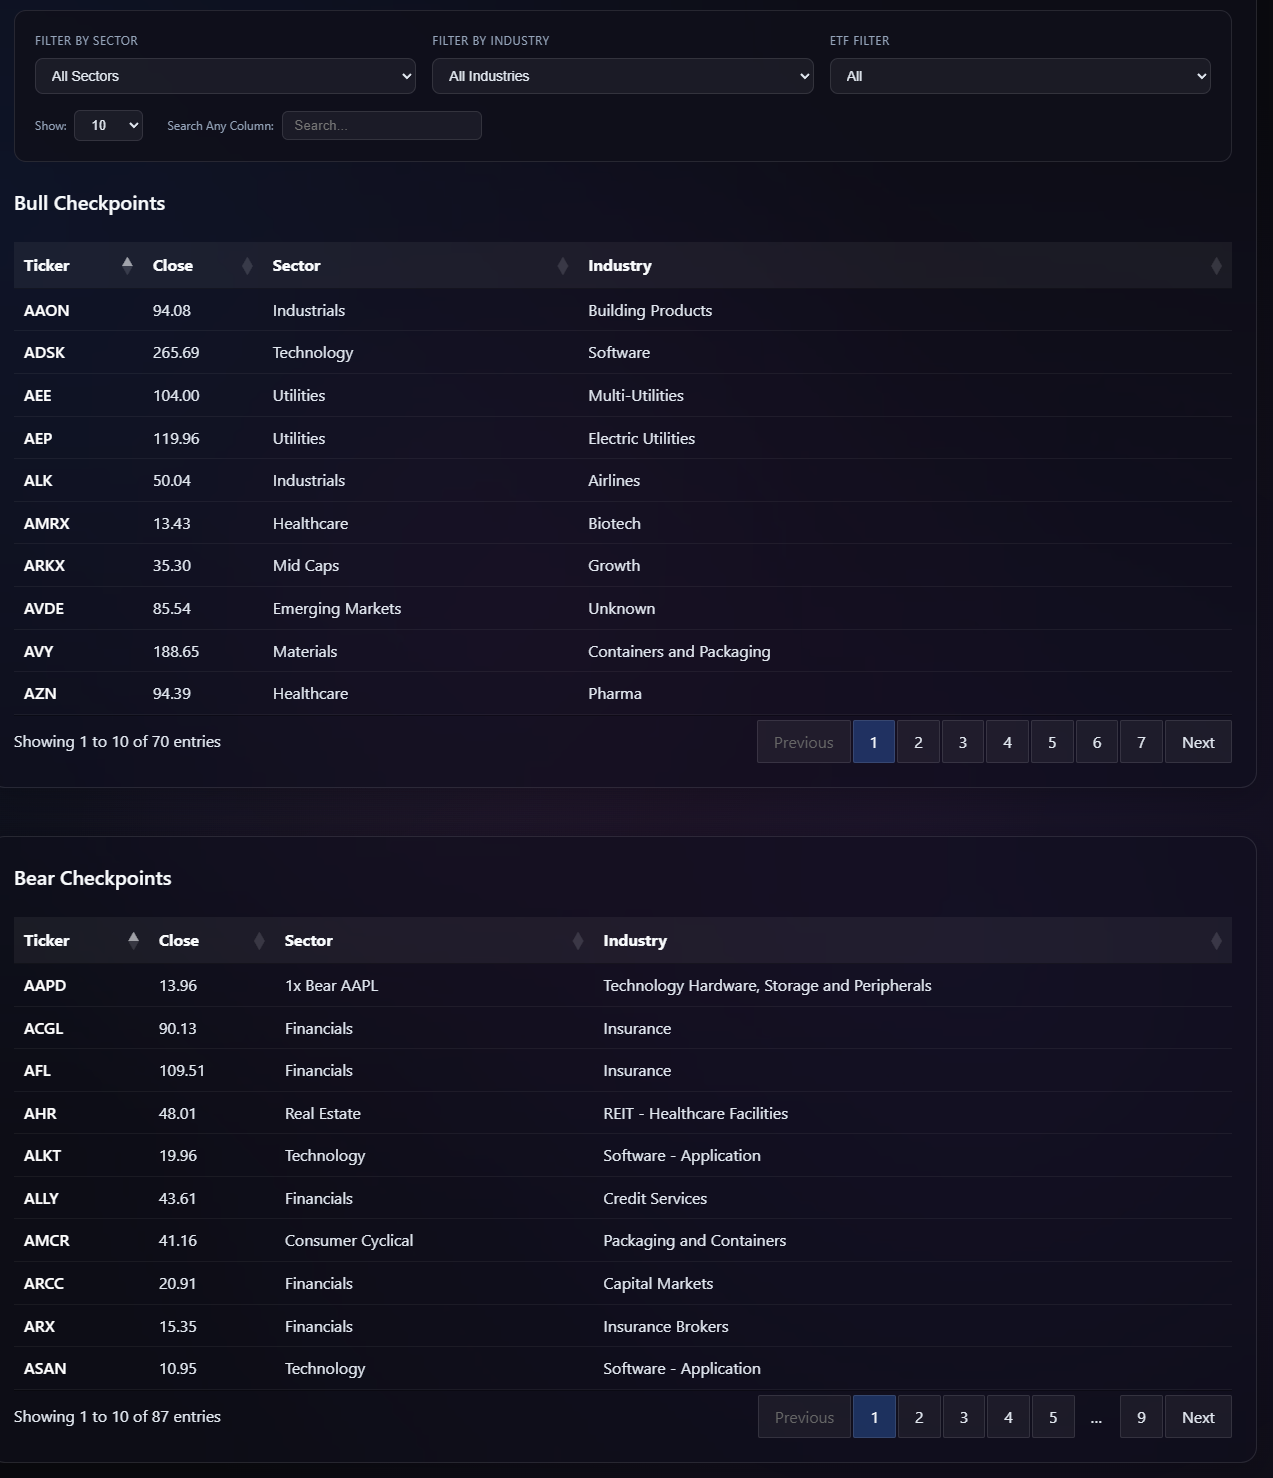
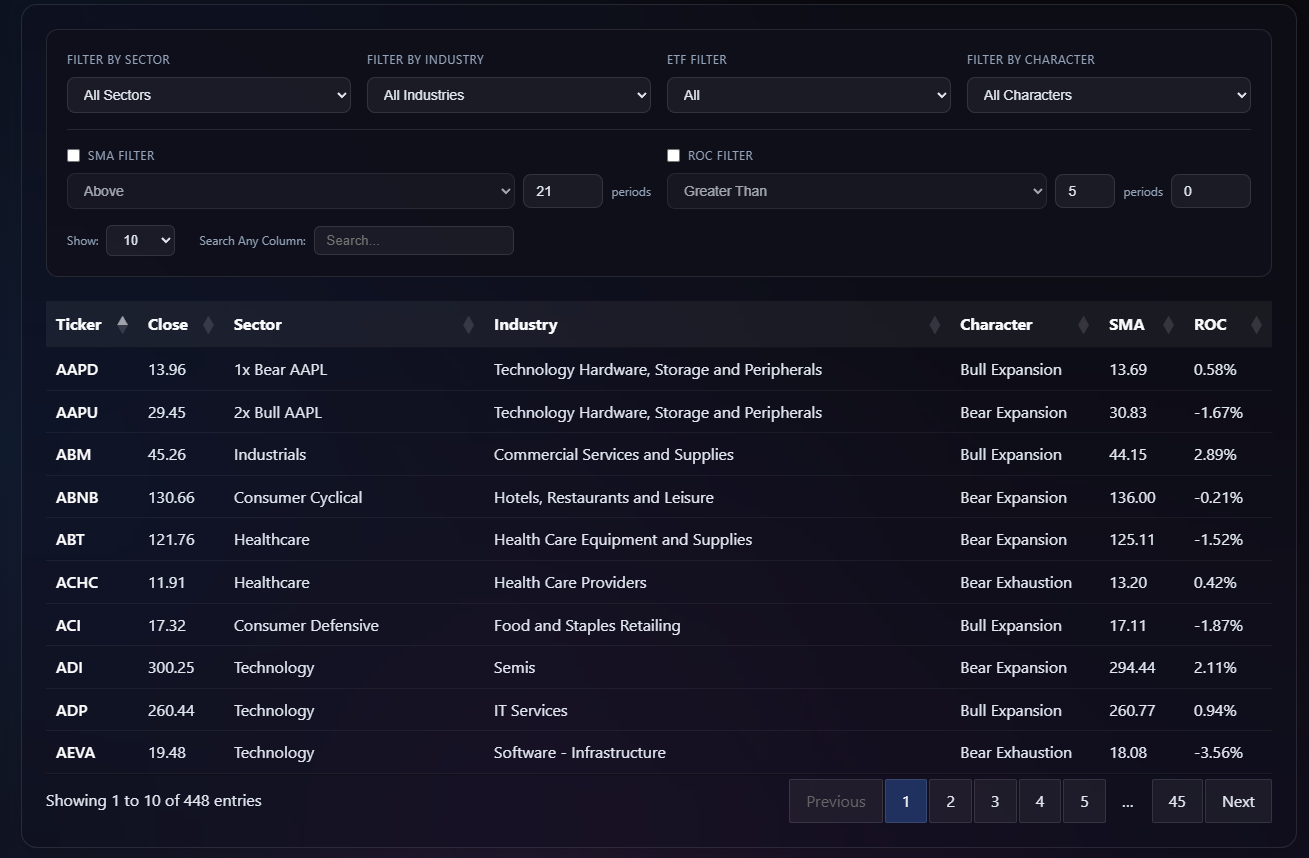
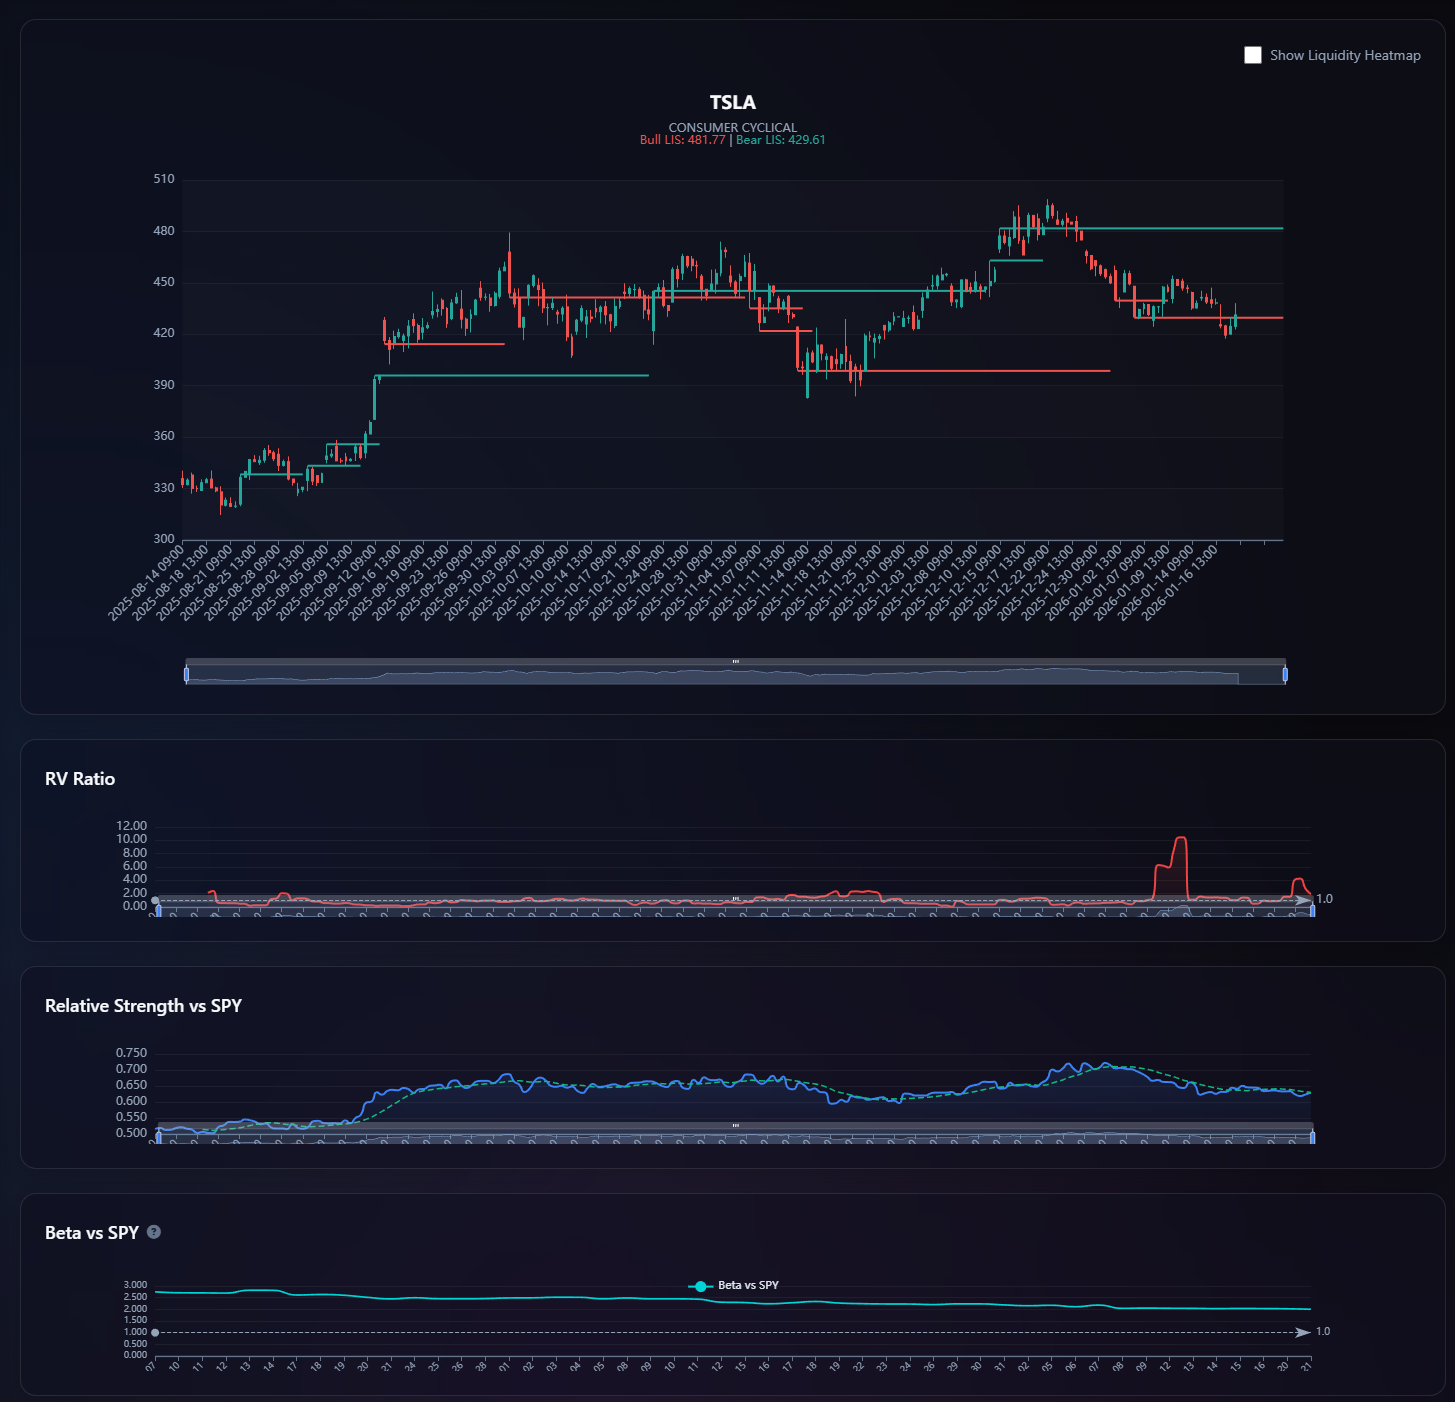
STIX codifies these insights for individual traders. By calculating institutional positioning across multiple timeframes, sectors and tickers and visualising the exact price zones where big money is active, STIX lets you see the current, not just the wave. Whether you trade momentum, mean reversion or simply want to avoid chasing noise, understanding institutional order flow gives you an objective framework to make better decisions.